Explore the week’s TidyTuesday challenge. Develop a research question, then answer it through a short data story with effective visualization(s). Provide sufficient background for readers to grasp your narrative.
Research question: How do the temporal and geographical factors affect the record of frogs in Australia in 2023?
Code
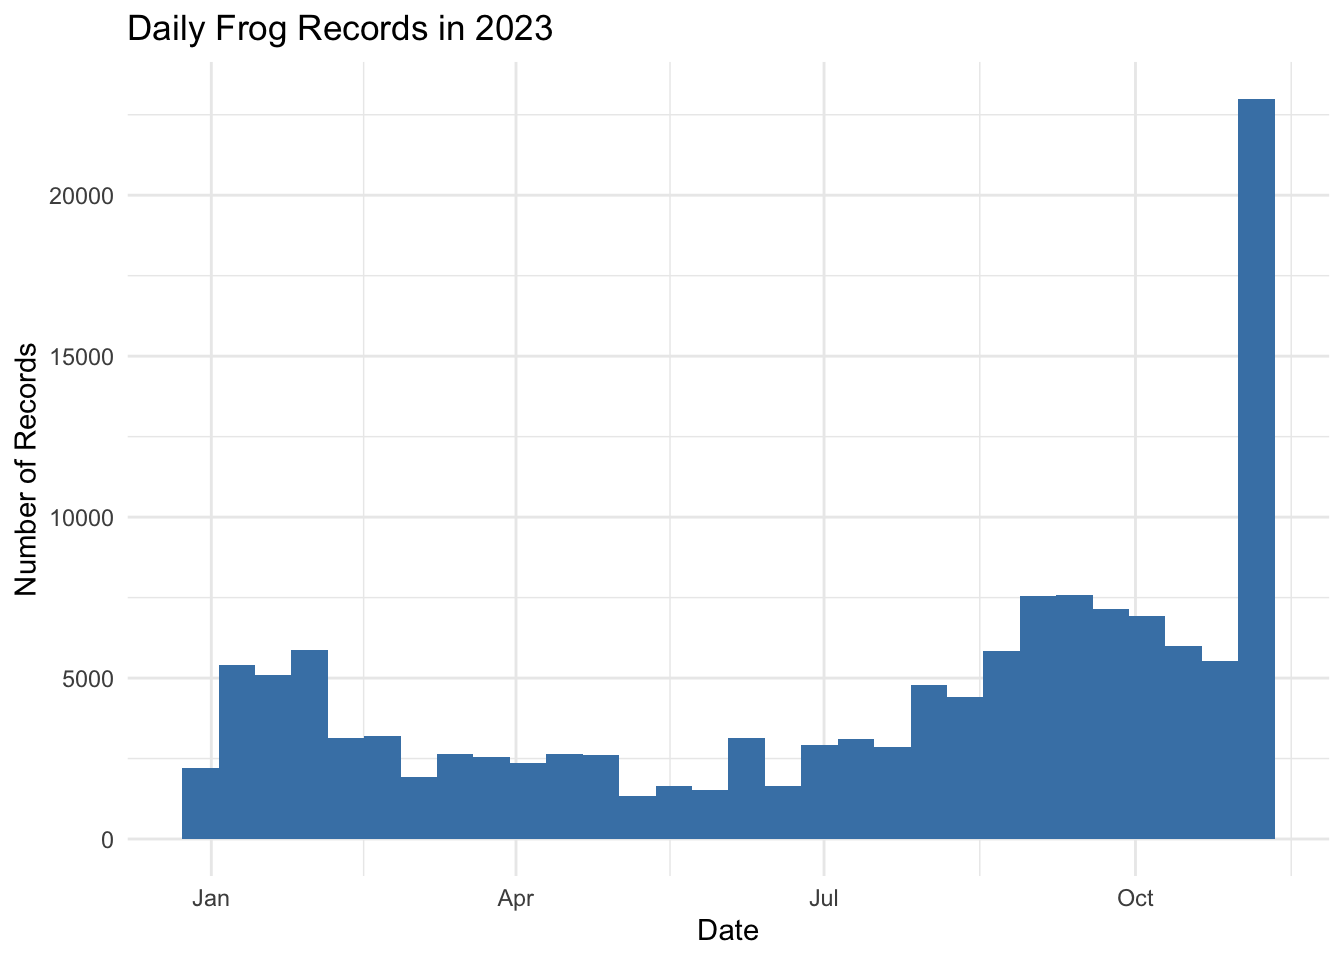
# Daily recording countsggplot(frogID_data, aes(x = eventDate)) +geom_histogram(fill ="steelblue") +labs(title ="Daily Frog Records in 2023",x ="Date", y ="Number of Records") +theme_minimal()
Code
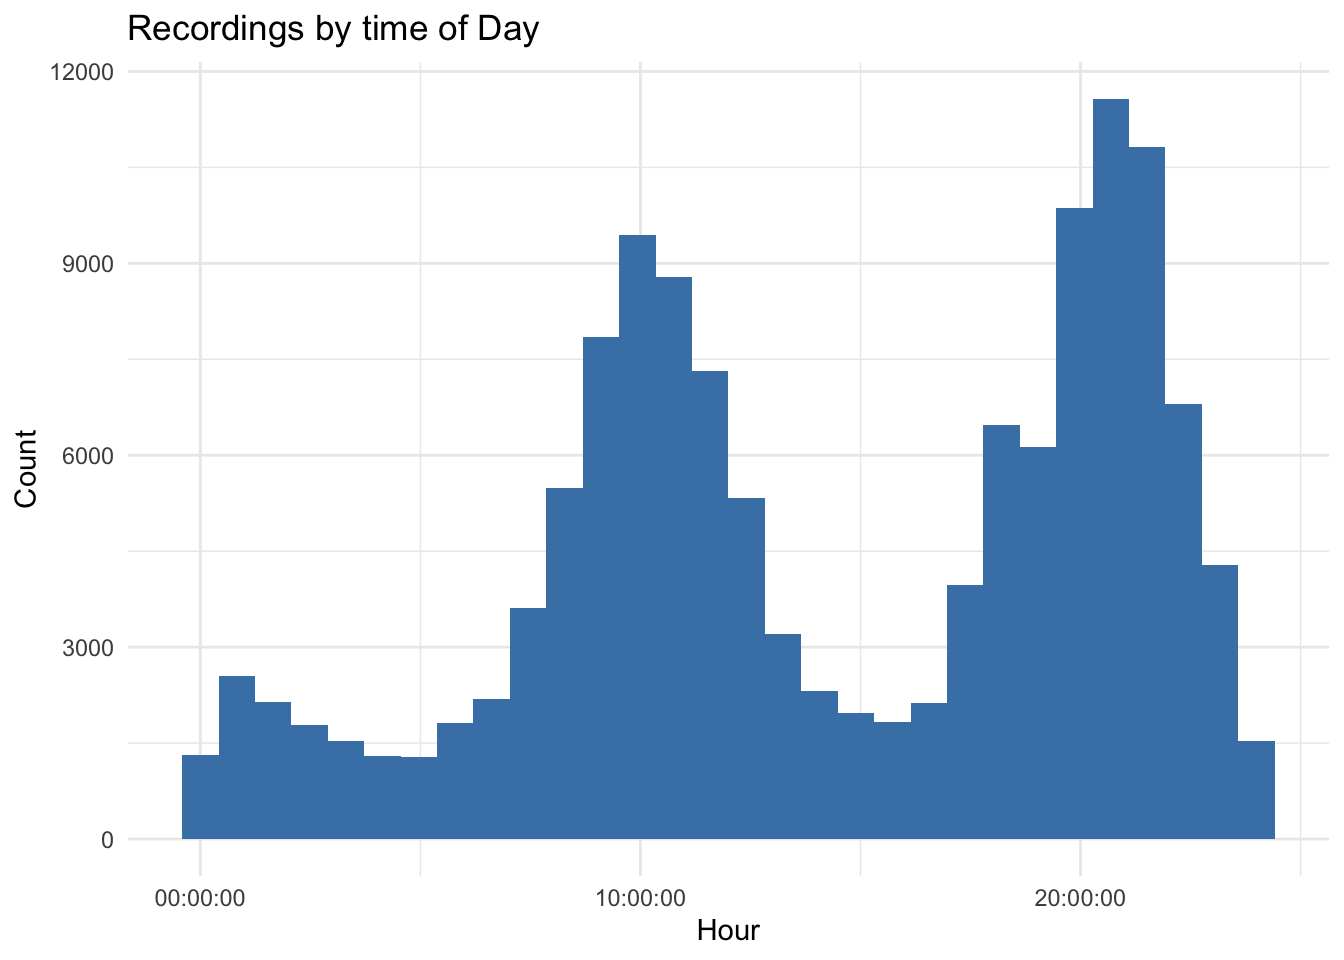
# Record time of the dayggplot(frogID_data, aes(x = eventTime)) +geom_histogram(fill ="steelblue") +labs(title ="Recordings by time of Day",x ="Hour", y ="Count") +theme_minimal()
Code
# Frog location distribution maplibrary(leaflet)leaflet(frogID_data) %>%addTiles() %>%addCircleMarkers(~decimalLongitude, ~decimalLatitude,radius =4, color ="darkgreen")
Conclusion: Frogs tend to occur more often around October, which is the spring season in Australia. It reflects frogs prefer warmer weather than colder one. According to the histogram graph that depicts the time frogs being recorded in the day, they are most active around 10am in the morning and 20pm at night. Based on the point map, we can clearly perceive that frogs like to gather near the water source.
Source Code
---title: "Homework 01"author: "Kangyu Li"---## TidyTuesday SectionExplore the week's [TidyTuesday](https://github.com/rfordatascience/tidytuesday) challenge. Develop a research question, then answer it through a short data story with [effective visualization(s)]({{< var effective-viz-url >}}). Provide sufficient background for readers to grasp your narrative.```{r}library(ggplot2)``````{r}frogID_data <- readr::read_csv('https://raw.githubusercontent.com/rfordatascience/tidytuesday/main/data/2025/2025-09-02/frogID_data.csv')frog_names <- readr::read_csv('https://raw.githubusercontent.com/rfordatascience/tidytuesday/main/data/2025/2025-09-02/frog_names.csv')```> Research question: How do the temporal and geographical factors affect the record of frogs in Australia in 2023?```{r}# Daily recording countsggplot(frogID_data, aes(x = eventDate)) +geom_histogram(fill ="steelblue") +labs(title ="Daily Frog Records in 2023",x ="Date", y ="Number of Records") +theme_minimal()``````{r}# Record time of the dayggplot(frogID_data, aes(x = eventTime)) +geom_histogram(fill ="steelblue") +labs(title ="Recordings by time of Day",x ="Hour", y ="Count") +theme_minimal()``````{r}# Frog location distribution maplibrary(leaflet)leaflet(frogID_data) %>%addTiles() %>%addCircleMarkers(~decimalLongitude, ~decimalLatitude,radius =4, color ="darkgreen")```> Conclusion: Frogs tend to occur more often around October, which is the spring season in Australia. It reflects frogs prefer warmer weather than colder one. According to the histogram graph that depicts the time frogs being recorded in the day, they are most active around 10am in the morning and 20pm at night. Based on the point map, we can clearly perceive that frogs like to gather near the water source.