---
title: "ICA Sept 8"
---
```{r}
library(tidyverse)
weather <- read_csv("https://mac-stat.github.io/data/sfo_weather.csv")
```
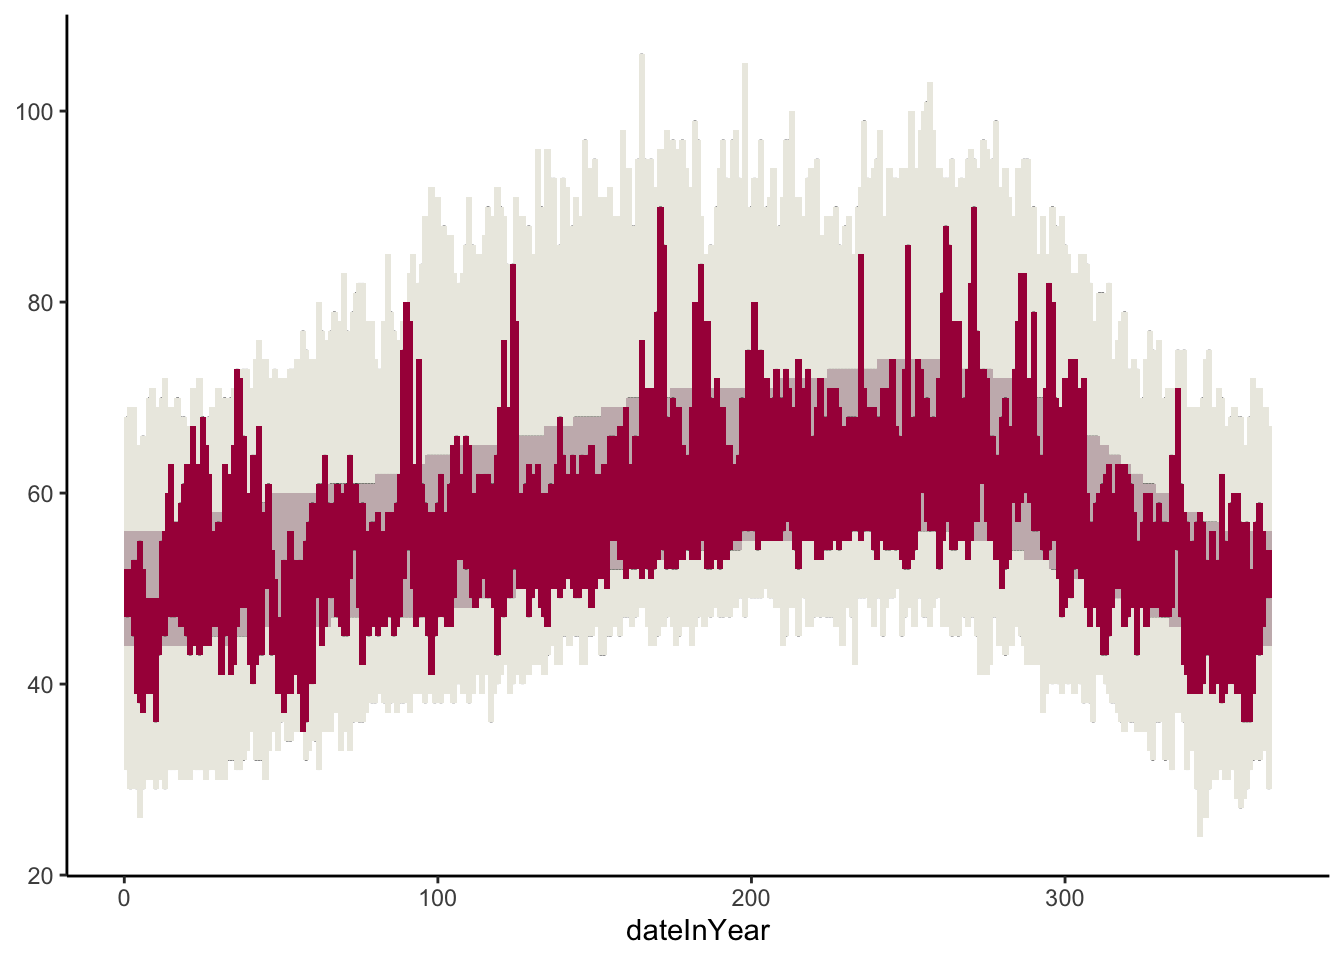
```{r}
library(dplyr)
ggplot(weather) +
  geom_linerange(aes(x=dateInYear, ymin=RecordLow, ymax = RecordHigh)) +
  geom_rect(aes(xmin=dateInYear-1,xmax=dateInYear+1, ymin=RecordLow,ymax=RecordHigh), fill="#ECEBE3", data=weather) +
  geom_linerange(aes(x=dateInYear, ymin=NormalLow, ymax=NormalHigh)) +
  geom_rect(aes(xmin=dateInYear-1,xmax=dateInYear+1, ymin=NormalLow,ymax=NormalHigh), fill="#C8B8BA", data=weather) +
  geom_linerange(aes(x=dateInYear, ymin=Low, ymax=High)) +
  geom_rect(aes(xmin=dateInYear-1,xmax=dateInYear+1, ymin=Low,ymax=High), fill = "#A90248", data=weather) +
  theme_classic()
```
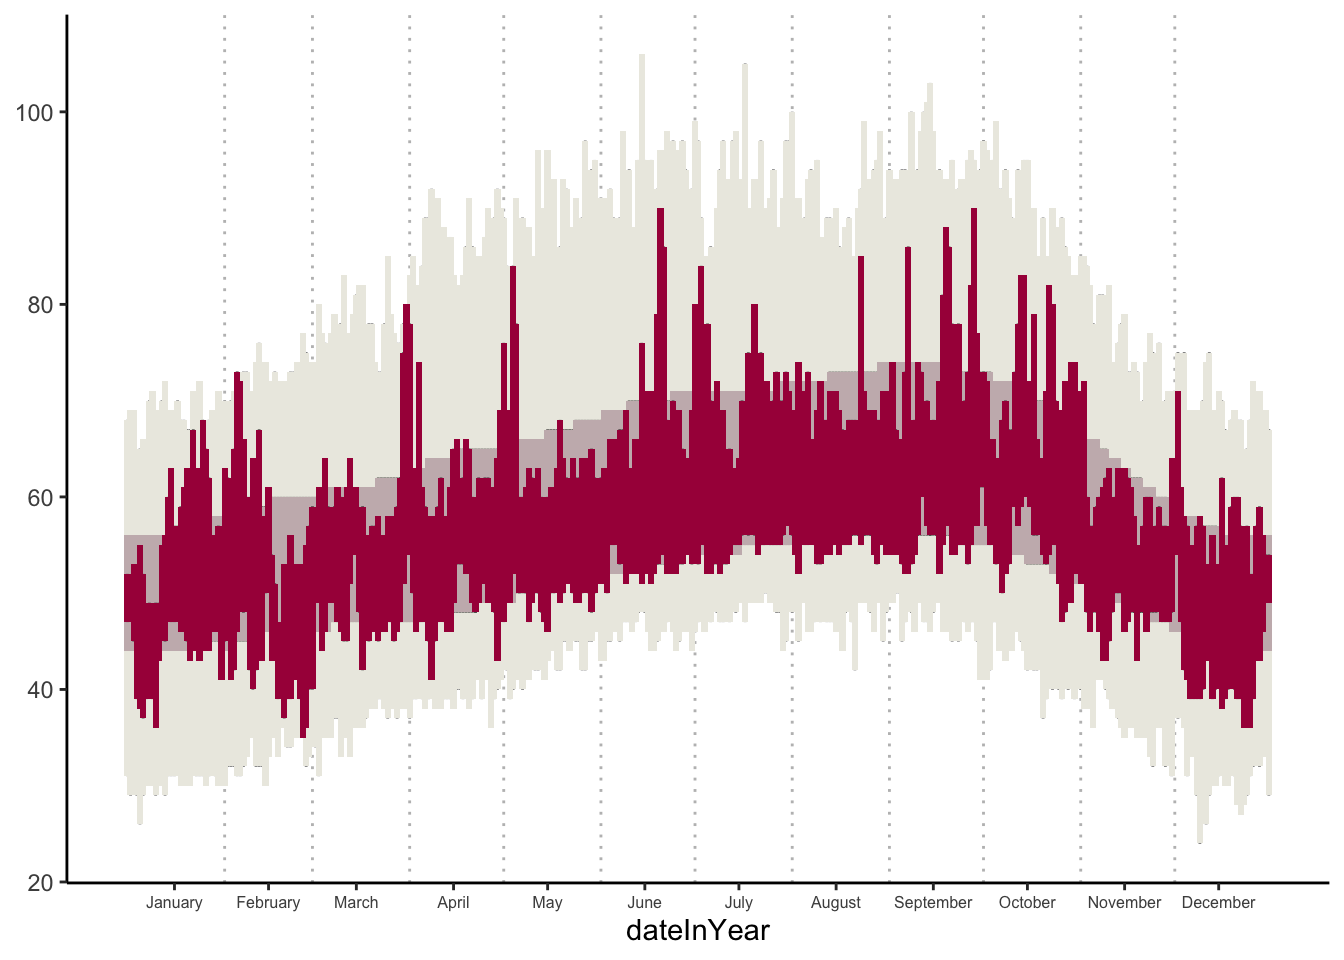
```{r}
weather$monthName <- factor(month.name[weather$Month], levels=month.name)

days_in_month <- c(31,28,31,30,31,30,31,31,30,31,30,31)
month_starts <- c(1, cumsum(days_in_month)[-12])

ggplot(weather) +
  geom_vline(
    data = subset(weather, Day==1 & Month != 1),
    aes(xintercept=dateInYear),
    linetype = "dotted",
    color = "grey") +
  geom_linerange(aes(x=dateInYear, ymin=RecordLow, ymax = RecordHigh)) +
  geom_rect(aes(xmin=dateInYear-1,xmax=dateInYear+1, ymin=RecordLow,ymax=RecordHigh), fill="#ECEBE3", data=weather) +
  geom_linerange(aes(x=dateInYear, ymin=NormalLow, ymax=NormalHigh)) +
  geom_rect(aes(xmin=dateInYear-1,xmax=dateInYear+1, ymin=NormalLow,ymax=NormalHigh), fill="#C8B8BA", data=weather) +
  geom_linerange(aes(x=dateInYear, ymin=Low, ymax=High)) +
  geom_rect(aes(xmin=dateInYear-1,xmax=dateInYear+1, ymin=Low,ymax=High), fill = "#A90248", data=weather) +
  scale_x_continuous(
    breaks = month_starts + 15,
    labels = month.name) +
  theme_classic() +
  theme(axis.text.x = element_text(size = 6))
```
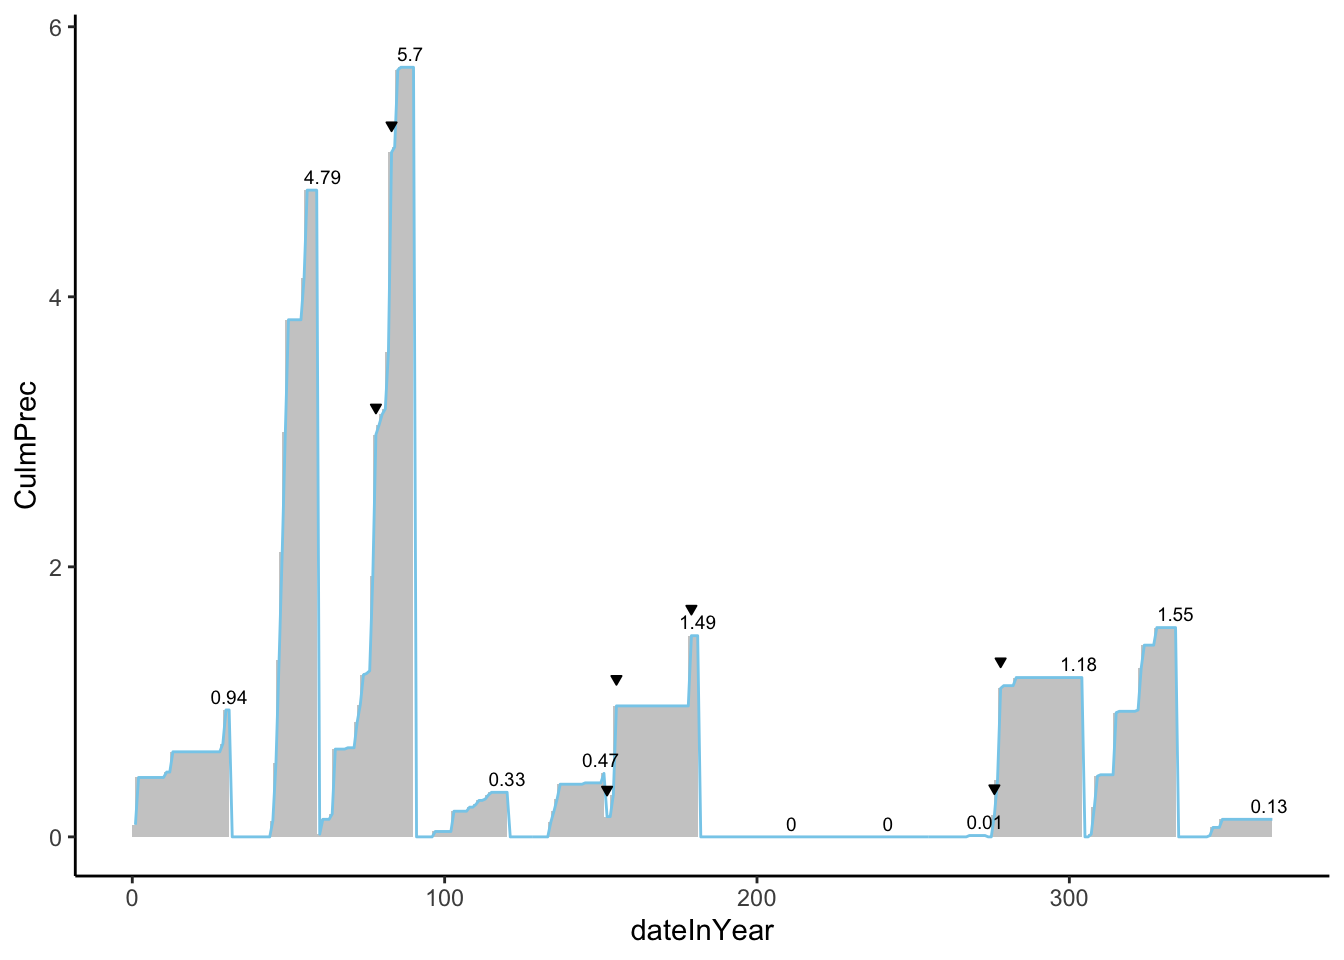
```{r}
PrecMonth <- weather %>%
  group_by(Month) %>%
  filter(Day == max(Day)) %>%
  ungroup() %>%
  select(`Day`, `CulmPrec`)

positions <- data.frame(
  x = month_starts + 30,
    y = PrecMonth$CulmPrec + 0.1,
  label = PrecMonth$CulmPrec
)

weather %>%
  ggplot(aes(x=dateInYear, y=CulmPrec)) +
  geom_rect(aes(xmin=dateInYear-1,xmax=dateInYear,ymin=0,ymax=CulmPrec), fill="grey80", data=weather) +
  geom_line(color="skyblue") +
  geom_text(
    data = positions,
    aes(x = x, y = y, label = label),
    size = 2.5
  ) +
  geom_point(
    data = weather %>% filter(RecordP == TRUE),
    aes(x = dateInYear, y = CulmPrec + 0.2),
    shape = 25,
    fill = "black",
    size = 1
  ) +
  theme_classic()
```