#Cleaning data and refactoring itpenguins_clean <- penguins[complete.cases(penguins), ]penguins_clean$sex <-case_when( penguins_clean$sex =="male"~"Male", penguins_clean$sex =="female"~"Female")penguins_clean$sex <-factor(penguins_clean$sex, levels =c("Male", "Female"))
Code
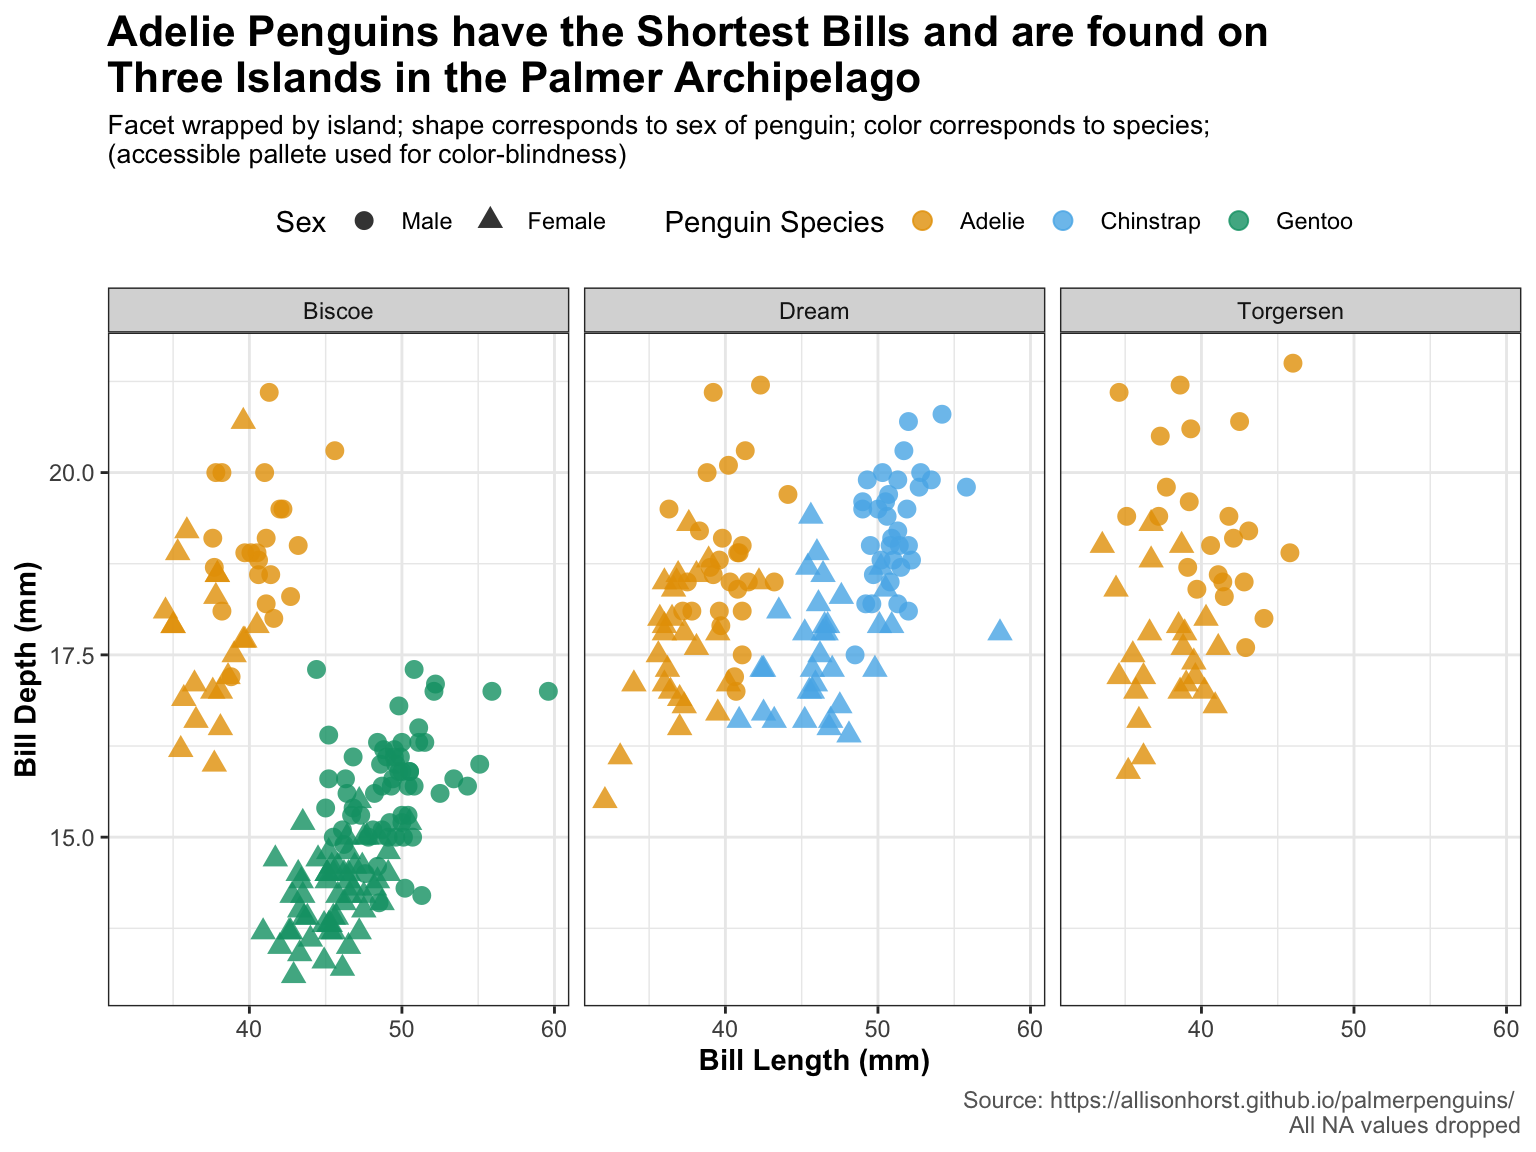
#Final visualizationggplot(penguins_clean, aes(x=bill_len, y=bill_dep, color=species, shape=sex)) +geom_point(alpha =0.8, size =3) +scale_color_manual(values =c("#E69F00","#56B4E9","#009E73" )) +facet_wrap(~island) +labs(title ="Adelie Penguins have the Shortest Bills and are found on \nThree Islands in the Palmer Archipelago",subtitle ="Facet wrapped by island; shape corresponds to sex of penguin; color corresponds to species; \n(accessible pallete used for color-blindness)",caption ="Source: https://allisonhorst.github.io/palmerpenguins/ \nAll NA values dropped",x ="Bill Length (mm)",y ="Bill Depth (mm)",color ="Penguin Species",shape ="Sex")+theme_bw() +theme(legend.position ="top",plot.title =element_text(face ="bold", size =16),plot.subtitle =element_text(size =10),axis.title =element_text(face ="bold", size =11),plot.caption =element_text(color ="gray40") )
Source Code
---title: "Professional Viz Sample"---```{r}library(tidyverse)library(ggplot2)``````{r}#Exploratory data analysisdim(penguins)unique(penguins$island)``````{r}#Cleaning data and refactoring itpenguins_clean <- penguins[complete.cases(penguins), ]penguins_clean$sex <-case_when( penguins_clean$sex =="male"~"Male", penguins_clean$sex =="female"~"Female")penguins_clean$sex <-factor(penguins_clean$sex, levels =c("Male", "Female"))``````{r, fig.width = 8, fig.height = 6}#Final visualizationggplot(penguins_clean, aes(x=bill_len, y=bill_dep, color=species, shape=sex)) + geom_point(alpha = 0.8, size = 3) + scale_color_manual(values = c( "#E69F00", "#56B4E9", "#009E73" )) + facet_wrap(~island) + labs(title = "Adelie Penguins have the Shortest Bills and are found on \nThree Islands in the Palmer Archipelago", subtitle = "Facet wrapped by island; shape corresponds to sex of penguin; color corresponds to species; \n(accessible pallete used for color-blindness)", caption = "Source: https://allisonhorst.github.io/palmerpenguins/ \nAll NA values dropped", x = "Bill Length (mm)", y = "Bill Depth (mm)", color = "Penguin Species", shape = "Sex")+ theme_bw() + theme( legend.position = "top", plot.title = element_text(face = "bold", size = 16), plot.subtitle = element_text(size = 10), axis.title = element_text(face = "bold", size = 11), plot.caption = element_text(color = "gray40") )```