#data exploration on missingnesscolSums(is.na(rank_by_year))
           code         country          region            rank visa_free_count
             20               0               0               0               0
           year
              0
Code
#cleaning data and summarizing itrank_by_year_clean <- rank_by_year %>%filter(year==2025) %>%group_by(region) %>%summarize(visa =mean(visa_free_count)) %>%arrange(desc(visa)) %>%mutate(region =factor(region, levels = region))
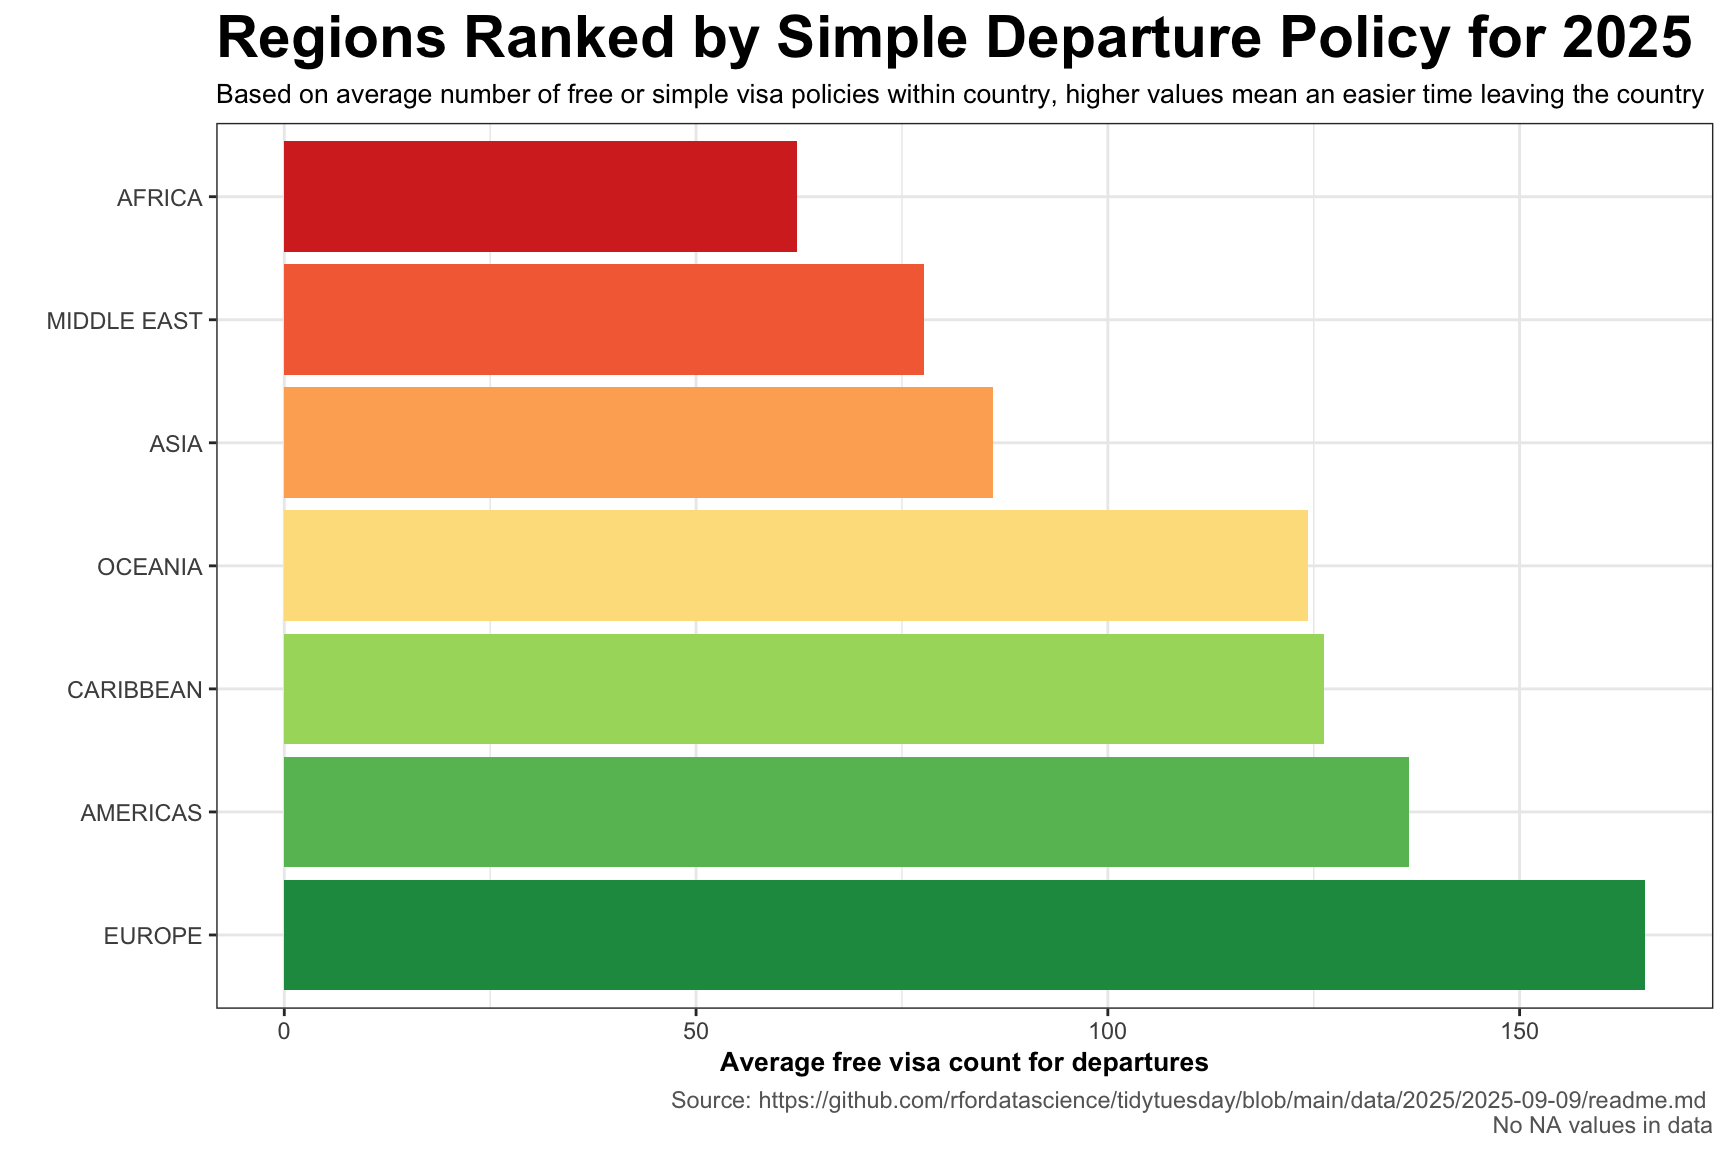
#Research Question: Which regions of the world are most difficut to depart from, based on free visa policy within that regions’ countries?
Each country in the world has a list of other countries that are allowed to enter without visa, or only with visa. Additionally, certain country are allowed in with a visa, but can obtain the visa in the airport. I wanted to use the data in the Week 36 TidyTuesday dataset to explore which regions of the world were most leniant and strict about these flight conditions.
Code
#final visualizationggplot(rank_by_year_clean, aes(x=region, y=visa, fill=region)) +geom_col() +scale_fill_manual(values =c("#1A9850","#66BD63","#A6D96A","#FEE08B","#FDAE61","#F46D43","#D73027" )) +labs(title ="Regions Ranked by Simple Departure Policy for 2025",subtitle ="Based on average number of free or simple visa policies within country, higher values mean an easier time leaving the country",caption ="Source: https://github.com/rfordatascience/tidytuesday/blob/main/data/2025/2025-09-09/readme.md \nNo NA values in data",x ="",y ="Average free visa count for departures") +theme_bw() +theme(legend.position ="none",plot.title =element_text(face ="bold", size =22),plot.subtitle =element_text(size =10),axis.title =element_text(face ="bold", size =10),plot.caption =element_text(color ="gray40") ) +coord_flip()
Source Code
---title: "TidyTuesday2025-Week36"---```{r}library(dplyr)library(ggplot2)country_lists <- readr::read_csv('https://raw.githubusercontent.com/rfordatascience/tidytuesday/main/data/2025/2025-09-09/country_lists.csv')rank_by_year <- readr::read_csv('https://raw.githubusercontent.com/rfordatascience/tidytuesday/main/data/2025/2025-09-09/rank_by_year.csv')``````{r}#data exploration on missingnesscolSums(is.na(rank_by_year))``````{r}#cleaning data and summarizing itrank_by_year_clean <- rank_by_year %>%filter(year==2025) %>%group_by(region) %>%summarize(visa =mean(visa_free_count)) %>%arrange(desc(visa)) %>%mutate(region =factor(region, levels = region))```#Research Question: Which regions of the world are most difficut to depart from, based on free visa policy within that regions' countries?Each country in the world has a list of other countries that are allowed to enter without visa, or only with visa. Additionally, certain country are allowed in with a visa, but can obtain the visa in the airport. I wanted to use the data in the Week 36 TidyTuesday dataset to explore which regions of the world were most leniant and strict about these flight conditions.```{r, fig.width=9, fig.height=6}#final visualizationggplot(rank_by_year_clean, aes(x=region, y=visa, fill=region)) + geom_col() + scale_fill_manual(values = c( "#1A9850", "#66BD63", "#A6D96A", "#FEE08B", "#FDAE61", "#F46D43", "#D73027" )) + labs(title = "Regions Ranked by Simple Departure Policy for 2025", subtitle = "Based on average number of free or simple visa policies within country, higher values mean an easier time leaving the country", caption = "Source: https://github.com/rfordatascience/tidytuesday/blob/main/data/2025/2025-09-09/readme.md \nNo NA values in data", x = "", y = "Average free visa count for departures") + theme_bw() + theme( legend.position = "none", plot.title = element_text(face = "bold", size = 22), plot.subtitle = element_text(size = 10), axis.title = element_text(face = "bold", size = 10), plot.caption = element_text(color = "gray40") ) + coord_flip()```