Homework 04
TidyTuesday Section (optional)
You can count work on this week’s TidyTuesday toward the exceptional work required for an A in the Homework component.
Explore the week’s TidyTuesday challenge. Develop a research question, then answer it through a short data story with effective visualization(s). Provide sufficient background for readers to grasp your narrative.
About the Data
The Tidy Tuesday data for the week of 9/23/25 comes from FIDE (the International Chess Federation). It contains two datasets: August and September chess player ratings. Some key variables in the datasets include player name and birthday, federation, titles, and rating.
Driving Question: How are youth and women represented in the International Chess Federation?
I was interested in exploring the gender and age breakdowns of different variables, including federation and title. To ground my exploration, I first computed the overall representation of youth (age < 25) and female chess players.
Code
# A tibble: 1 × 2
  pct_women pct_youth
      <dbl>     <dbl>
1      10.4      46.4
We see that women are pretty underrepresented in the International Chess Federation. Youth, on the other hand, make up nearly 50% of the players.
For my first plot, I looked at the age distributions of title holders.
Code
fide_ratings_september %>%
  mutate(
    age = 2025 - bday,
    title = fct_recode(title,
      "Candidate Master" = "CM",
      "Grand Master" = "GM",
      "FIDE Master" = "FM",
      "International Master" = "IM",
      "Woman Candidate Master" = "WCM",
      "Woman FIDE Master" = "WFM",
      "Woman Grand Master" = "WGM",
      "Woman International Master" = "WIM"
    ),
    title = factor(title, c("Candidate Master", "Woman Candidate Master", "Grand Master", "Woman Grand Master",
      "FIDE Master", "Woman FIDE Master", "International Master", "Woman International Master"))
    ) %>%
  filter(!is.na(title)) %>%
  group_by(title) %>%
  ggplot(aes(x = age, y = title, fill = title)) +
  geom_violin() +
  geom_boxplot(width = 0.1, fill = "white") +
  theme_classic() +
  theme(legend.position = "none") +
  labs(title = str_wrap("Age Distribution of International Chess Federation (FIDE) Title Holders", 60), x = "", y = "", caption = "Cate Stacy, 10/1/25, Data From September FIDE Player Ratings")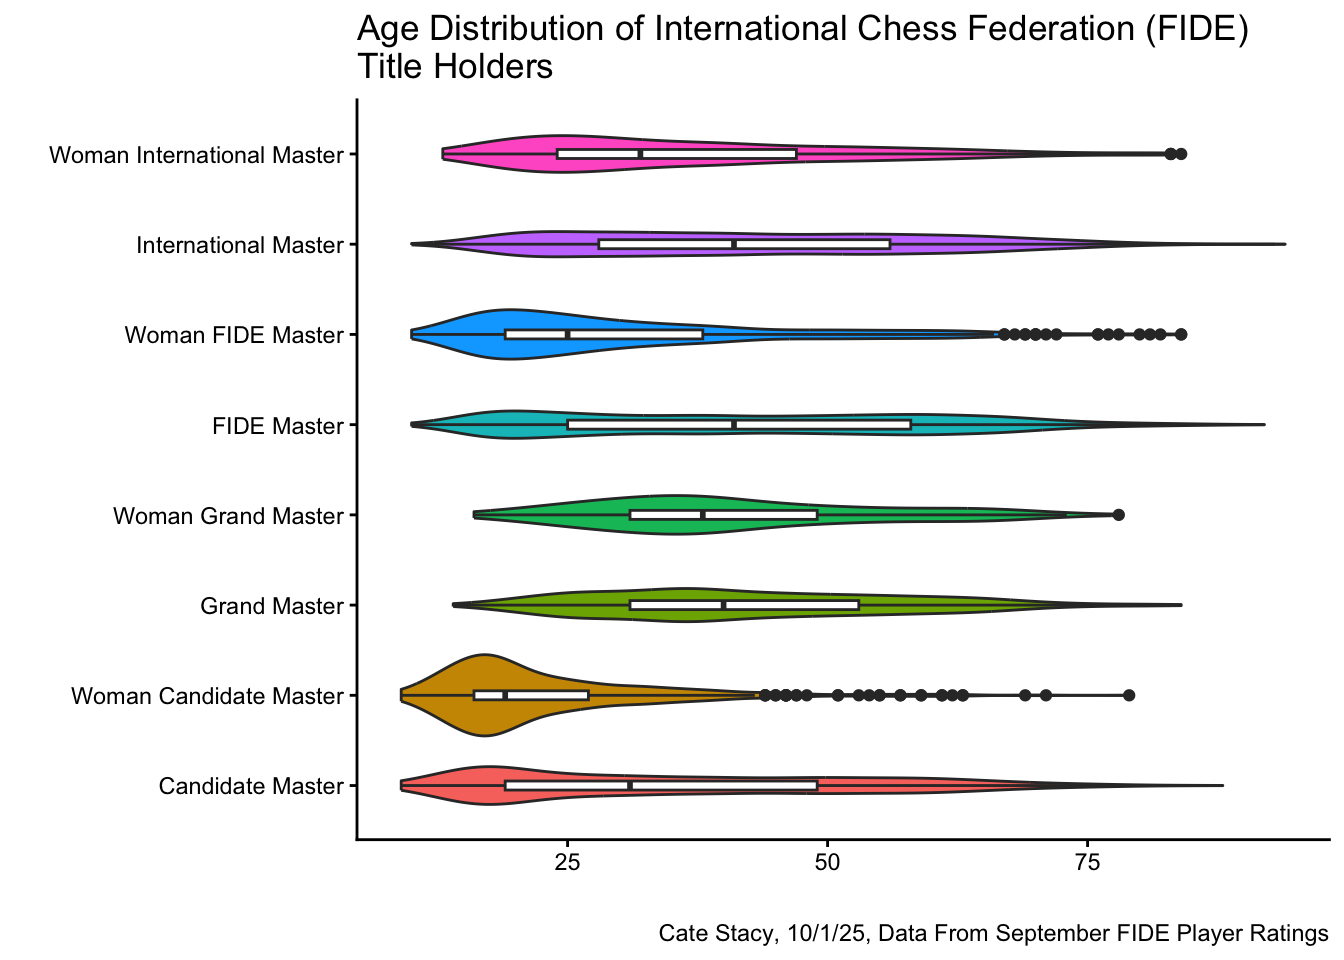
Despite youth making up almost half the dataset, we see that the mean ages of the majority of title holders are over 24. Interestingly, the mean age of title holders is younger for women than for men across all titles. It’s possible that this is because there is greater representation of women among younger players. This theory can be checked by computing the percent of women among players under the age of 25.
Code
# A tibble: 1 × 1
  pct_women
      <dbl>
1      16.9
The percentage of youth chess players who are female is greater than the overall percent of female chess players by a difference of about 6.6%.
The next plot explores the relationship between the percent of youth players and percent of female players within each federation.
Code
fide_ratings_september %>%
  mutate(age = 2025 - bday) %>%
  group_by(fed) %>%
  summarize(
    pct_w = sum(sex == "F")/length(sex) * 100,
    pct_y = sum(age <=24)/length(age) * 100
  ) %>%
  ggplot(aes(x = pct_y, y = pct_w)) +
  geom_point() +
  geom_smooth(method = "lm", se = FALSE) +
  theme_classic() +
  labs(title = "Percent of Women and Youth Chess Players Within Each Federation ", subtitle = "Cate Stacy, 10/1/25, Data From September FIDE Player Ratings", x = "percent youth", y = "percent women")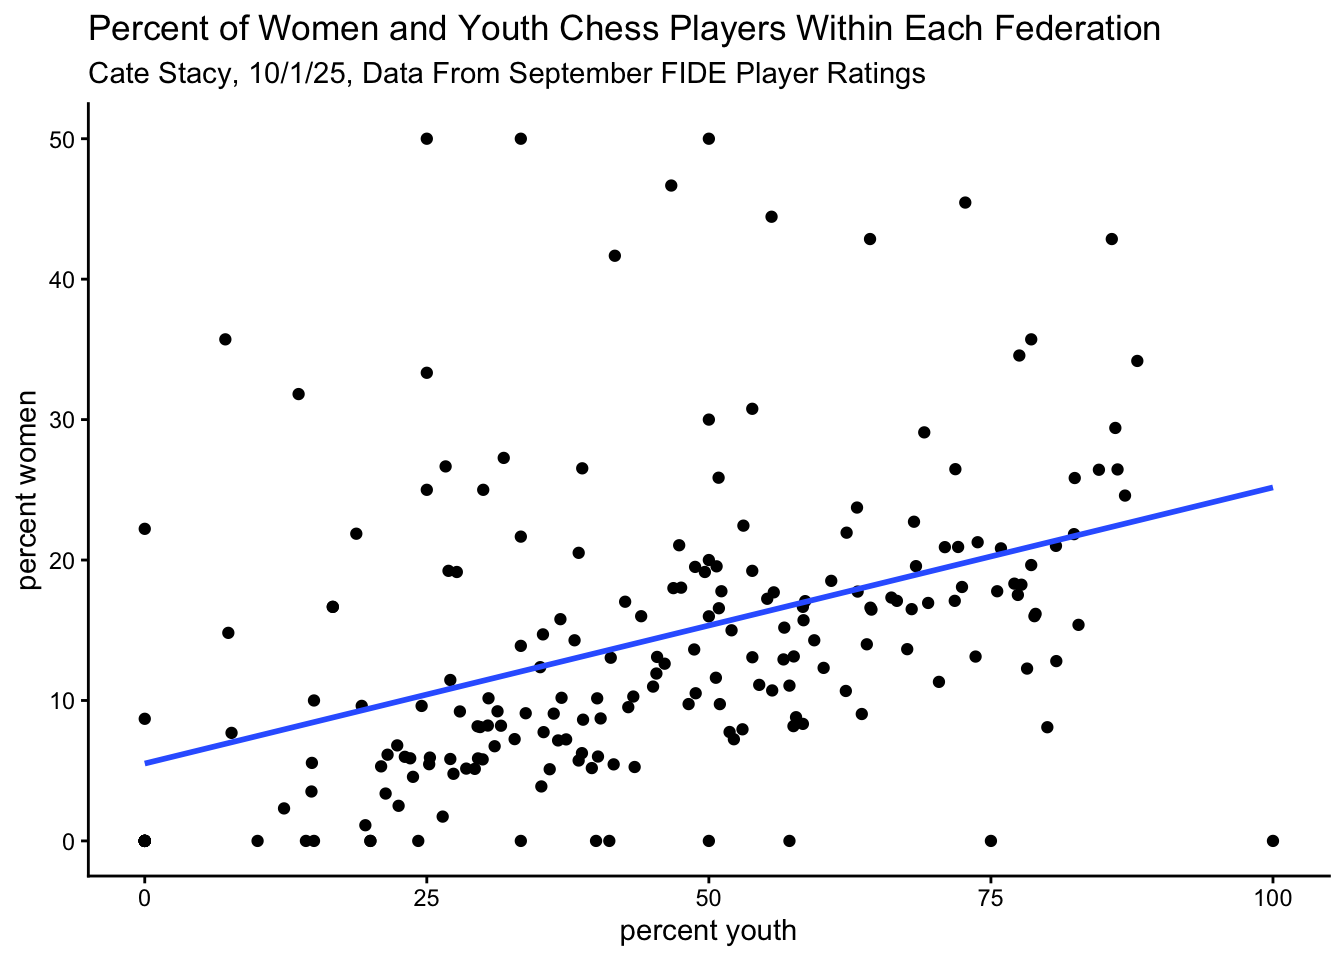
This plot displays a moderately strong, positive, linear relationship between the percent of youth and percent of female chess players within federations, meaning federations with more youth players also tend to have more female players.